


How to use VectorBT PRO to algorithmically find chart patterns
VectorBT PRO (VBT) is a proprietary Python package designed for backtesting and analyzing quantitative trading strategies.
In today’s guest post, you’ll use VectorBT PRO to algorithmically detect chart patterns from 230 million unique pattern and window combinations.
All in about 2 minutes.
Ready?
Using VectorBT PRO to algorithmically find chart patterns
VectorBT PRO provides a comprehensive suite of tools for every stage of an algorithmic trading workflow, including data acquisition, signal generation and analysis, portfolio optimization, strategy simulation, hyperparameter tuning, and cross-validation. These modular components empower users to flexibly customize their analysis, setting it apart from monolithic backtesting frameworks.
One of these components is a data pattern detector that efficiently scans data using variable-length windows, assessing their similarity to a specified pattern. This process operates on any hardware without the need for machine learning.
In today’s newsletter, we will conduct backtesting on a range of patterns and their combinations on a single dataset.
Imports and set up
Due to VectorBT PRO's self-contained design, only minimal imports are necessary.
VectorBT PRO features built-in data downloading from sources such as Yahoo Finance, Alpaca, Polygon, TradingView, and many more. We will perform pattern detection on hourly price data pulled from TradingView.
After slicing the data for the dates we want, we choose the suitable feature. We'll utilize HLC/3, which effectively captures price fluctuations.
Define 5 bullish and bearish patterns
Chart patterns can be translated into numerical sequences, like the "Double Top" represented as [1, 5, 3, 5, 1], below. It's important to note that while the numbers themselves can be arbitrary, their relative spacing should mirror the relative distance between the pattern's chart points. For instance, in this sequence, 2 aligns with the midpoint between valley point 1 and peak point 3. The same principle applies to temporal distribution: points should be equidistant from one another.
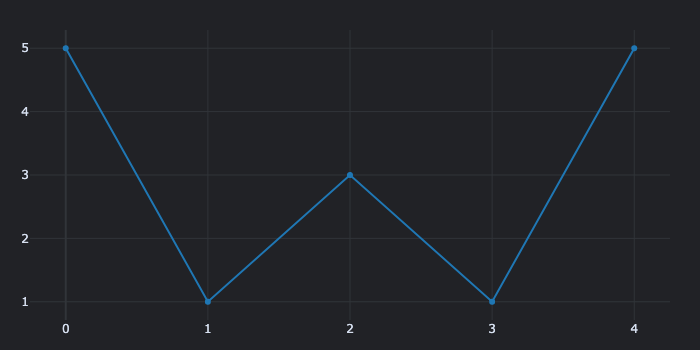
Each generated sequence serves as a rough approximation of the desired chart pattern, and there's no need for precise adjustments: VBT similarity-based algorithm is flexible and can identify patterns, even if they are not perfectly consistent in their design.
Detect the appearance of the patterns in the data
Iterate through each pattern, dataset, and timestamp within the dataset. Search for matches within windows spanning from 1 to 30 days, and create a record for each match that exceeds a pre-defined minimum similarity score, which is set by default to 85%.
In about two minutes, VBT detects matches among all patterns. This process, involving around 230 million unique pattern and window combinations, was executed in parallel.
Plot the pattern and dataset with the most matches.
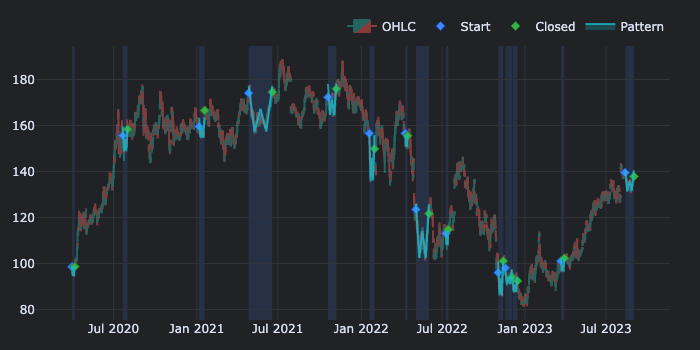
Or zoom in on a specific match.
The window data closely aligns with the pattern. This functionality is highly comprehensive, offering the flexibility to adjust fitness levels, modify rescaling and interpolation algorithms, and more to suit specific requirements.
Transform the matches and backtest the signals
To conduct backtesting on the identified patterns, we will convert them into signals, triggering a signal once a pattern has fully developed.
This code generate a Cartesian product of bullish and bearish patterns to systematically test each bullish pattern against each bearish pattern. Both arrays have been converted into equally-shaped DataFrames with each column representing an individual backtest, encompassing three parameters: bullish pattern, bearish pattern, and symbol.
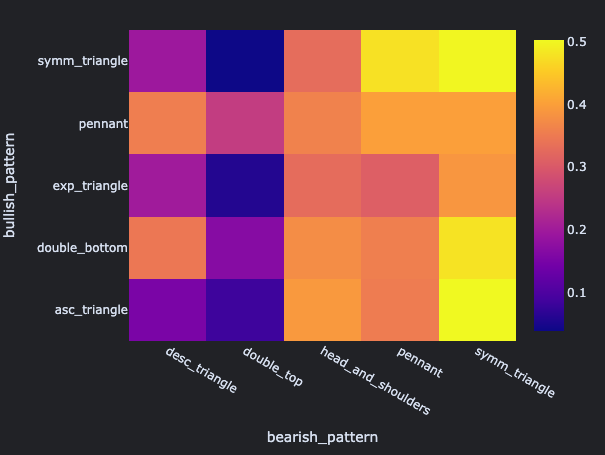
Next, establish a portfolio by simulating signals and get the mean total return for every combination of bullish and bearish patterns.
From there, generate a heat map to visualize where the best combination might lie.
Next steps
Although the displayed performance of each pattern combination does not guarantee future results, it provides insight into how the market responded to pattern events in the past. For instance, it's noteworthy that the "Bearish Symmetrical Triangle" exhibited a notably bullish trend. Cross-validation and robustness testing are next essential steps for a comprehensive assessment.