Here’s what probably happened.
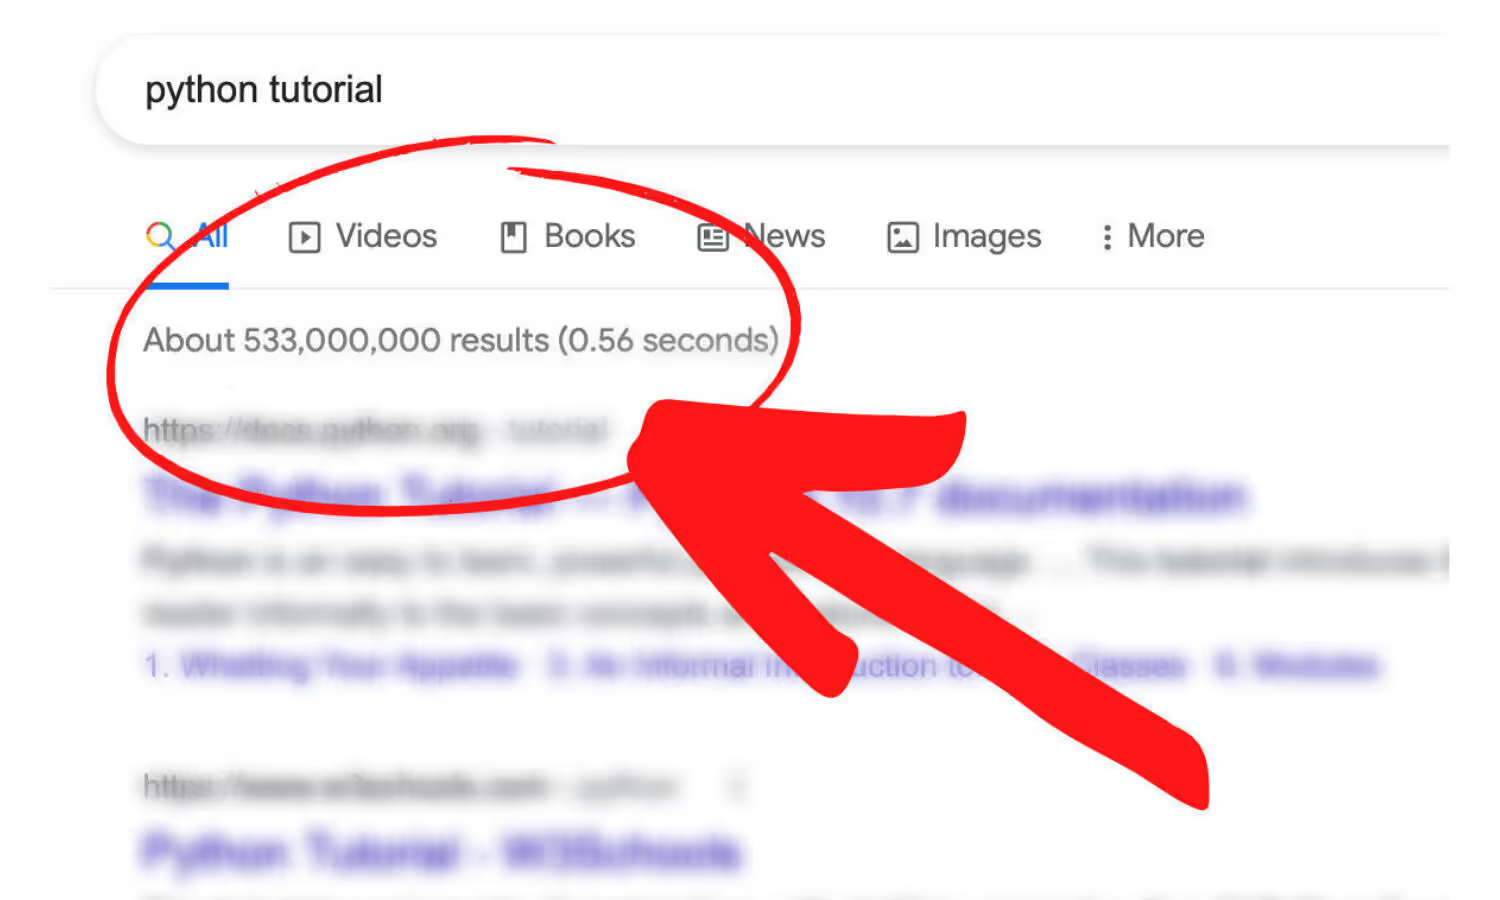
You googled “learn Python for finance.”
You got 533 million results. You picked the first paid ad and spent $19 on a Udemy course.
You learned how to print “Hello World” and build a tic-tac-toe game from someone who has never traded a share, priced a derivative, or sat on a risk desk.
Then you tried another course. More syntax drills. More toy examples. Still no idea how to pull market data, build a backtest, or connect to a broker.
You’re not failing because you’re bad at Python.
You’re failing because nobody taught you Python for the thing you actually want to do.
The generic courses teach you programming. They don’t teach you how a quant uses Python to analyze $20 billion in derivatives exposure, or how a trader uses it to automate execution on Interactive Brokers, or how an analyst uses it to screen 21,000+ equities with factor pipelines.
That’s what this course teaches.
But first, let me show you why I built it.


