


3 ways quants detect market regimes for an edge
A market regime refers to the behavior of a market over a period of time. Market regimes can be classified as high volatility, mean reverting, trending, or something else.
Classifying market regimes is notoriously difficult (though it’s the secret of many successful funds).
Hidden Markov Models:
— PyQuant News 🐍 (@pyquantnews) April 12, 2024
They’re rumored to power Renaissance Technology’s $15,000,000,000 Medallion Fund.
They decode the secret patterns of the markets.
You can use them too.
Learn how: pic.twitter.com/mWJKtG5bTa
Investors identify market regimes to manage risk, diversify holdings, and take advantage of market moves. In other words, it is to avoid losing money or to make more money.
Most beginners try to detect market regimes using technical indicators:. “If the 50-day moving average crosses above the 200-day moving average, I’m bullish.” This is how I tried doing it for years. I did not have much luck.
Professional quants use statistical techniques. You can, too.
By reading today’s newsletter, you’ll identify growth and crash regimes using three statistical methods.
Let’s go!
Today’s newsletter is in partnership with the London Stock Exchange Group (LSEG). LSEG has 426 guides on how to build quantitative analytics with Python. LSEG and PyQuant News partner on content that beginners and pros read. The code described in this article is available for free in the LSEG Article Catalog.
Check out the code for today’s newsletter at LSEG 👉
3 ways quants detect market regimes for an edge
Identifying market regimes using machine learning requires unsupervised models. Some statistical techniques include vector autoregression and hidden Markov models. Others using more sophisticated machine learning include clustering, k-means, and Gaussian mixture models.
Lucky for us, all these tools are available in Python.
Today’s newsletter points to an article at LSEG that identifies boom and bust regimes. The article describes Gaussian Hidden Markov Models, k-means clustering, and Gaussian mixture models to determine the regimes.
The article goes on to build a simple investment strategy based on the market regimes.
If you don’t have access to Refiniv, you can easily replace the code that uses Refinitiv data with OpenBB Platform to download the data free.
Here’s what’s in store.
Data engineering
The article starts by deriving a new feature—the log return of the 7-day moving average of historical close prices.
We prefer using log returns over simple returns because they are symmetric, additive, and normalized to the current price. This makes log returns great for comparing across different time frames and instruments.
To prepare the data, the authors build a DataFrame that includes the close price, moving average price, and log returns. These are the data to be used as input for regime detection models.
Regime detection
Next, the article introduces machine learning algorithms used to determine market regimes.
It also details the implementation of the regime detection process on historical data of the S&P500. It does this through in-sample and out-of-sample testing.
The approach includes a range of methodologies for anomaly detection.
Additionally, the article explores unsupervised machine learning techniques to determine the regime. Each method has pros and cons. With Agglomerative Clustering merging data points into clusters based on linkage distances, GMM fitting data into multivariate Gaussian distributions, and HMM estimating hidden states based on observable data transitions.
The trading strategy
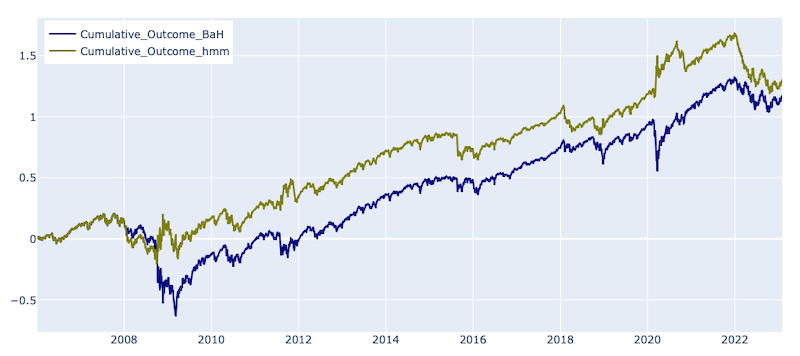
In this section, the article shows a simple investment strategy based on predicted hidden states. It generates a long signal when the market is expected to remain in a normal state and a short signal during crash or high volatility states.
The results show that the HMM-based strategy outperformed the Buy and Hold strategy, especially during market downturns like the financial crisis and the COVID crash.