


Easily cross-validate parameters to boost your trading strategy
Trading strategies often rely on parameters.
To enhance and effectively cross-validate these parameters can provide a competitive advantage in the market.
However, reliable cross-validation strategies can lead to look-ahead bias and other pitfalls that can lead to overestimating a strategy’s performance.
In today’s newsletter, we’ll use VectorBT PRO to easily implement a variety of sophisticated cross-validation methods with just a few lines of code.
Ready?
Easily cross-validate parameters to boost your trading strategy
VectorBT PRO offers several features that are highly beneficial for traders.
It allows for lightning-fast testing of trading strategies over historical data using a vectorized approach.
The framework supports extensive customization and optimization enabling traders to fine-tune strategies according to specific market conditions or personal trading styles.
VectorBT PRO is designed to handle large datasets and deal with complex analyses efficiently. It is tightly integrated with pandas which makes it easy to fit into existing data processing pipelines.
Let’s see how it works
Imports and set up
Let’s import VBT PRO and the few libraries relevant to our analysis.
Grab the data for your favorite asset. We’ll use AAPL.
Cross validation schema
Next, we’ll set up a "splitter," which divides a date range into smaller segments according to a chosen schema. For instance, lets allocate 12 months for training data and another 12 months for testing data, with this cycle repeating every 3 months.
First we segment the data into training and testing periods based on a specified frequency and a combined period of TRAIN + TEST months.
The split argument defines the training set as the first TRAIN months and the testing set as the subsequent TEST months in each split, while the set_labels argument names these segments.
The splitter.plots().show_png() command results in the following visualization:
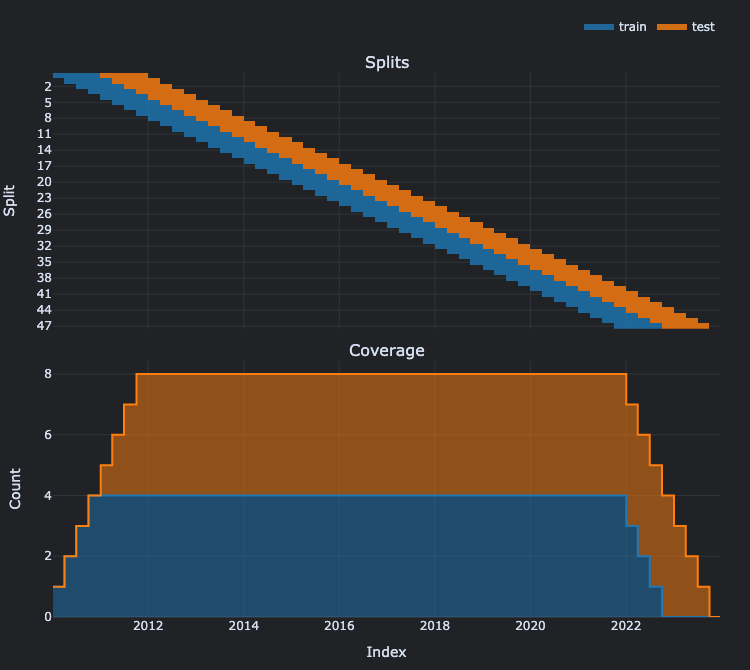
In the first subplot, we see that each split (or row) contains adjacent training and testing sets, progressively rolling from past to present.
The second subplot illustrates the overlap of each data point across different ranges. Tip: For non-overlapping testing sets, use the setting EVERY = TRAIN.
Parameter optimization
Next, we’ll create a function to execute a trading strategy within a specified date range using a single parameter set, returning one key metric. Our strategy will be a simple EMA crossover combined with an ATR trailing stop.
By decorating our function with parameterized, we enable objective to accept a list of parameters and execute them across all combinations. We’ll then further enhance the function with another decorator, split, which runs the strategy on each date range specified by the splitter.
This tests over 3 million combinations of date ranges and parameters in just a few minutes.
Analyze the results
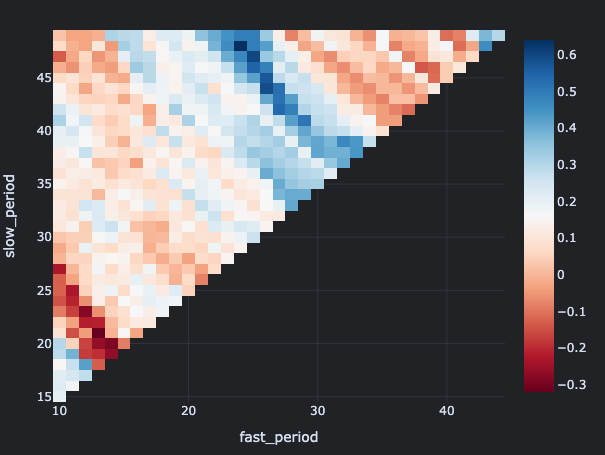
Let’s analyze the results by segmenting the fast and slow EMA periods. It highlights the minimal variation in the Sharpe ratio from the training to the testing set across at least 50% of the splits, where blue indicates a positive change.
The result is a heatmap showing the various Sharpe ratios across the slow and fast period combinations.
Next steps
Although you might have developed a promising strategy on paper, cross-validating it is essential to confirm its consistent performance over time and to ensure it’s not merely a result of random fluctuations. Apply the techniques you learned here to your own strategy.