Understanding volatility term structure and skew


Understanding volatility term structure and skew
Options trading is complex but understanding the implied volatility term structure and skew is crucial for success.
Today, I'll show you how to use Python to analyze and interpret the term structure and skew of options.
We'll explore how to plot the term structure and skew, interpret their shapes, and use them to make informed trading decisions.
By the end of this newsletter, you'll have the code and knowledge to navigate these concepts like a pro.
So, if you're ready to take your options trading to the next level, let's go!
Demystifying implied volatility: Understanding volatility term structure and skew
The options implied volatility term structure is a way to understand how the market perceives the future volatility of a stock over time. It shows the relationship between the implied volatilities of options with different expiration dates on the same stock.
And it matters.
By analyzing this term structure, traders can gain insights into market expectations of future volatility. The term structure can take different shapes, such as upward-sloping, downward-sloping, or flat, which indicate the market's expectations.
There's more.
Implied volatility skew refers to the difference in implied volatilities between options with different strike prices but the same expiration date. It shows how the market prices options based on their proximity to the current stock price.
These tools are essential for options traders and investors as they help in pricing options accurately, assessing risk, and constructing trading strategies.
Imports and set up
OpenBB has a suite of methods to download options data. We’ll need it for today’s issue. You can also import Matplotlib to do some light formatting on the charts.
1from openbb_terminal.sdk import openbb
2
3import matplotlib.pyplot as plt
4plt.rc("font", size=10)
Downloading the options chains is one line of code.
1chains = openbb.stocks.options.chains(
2    symbol="SPY",
3    source="YahooFinance"
4)
5
6expirations = openbb.stocks.options.expirations("SPY")
In this example, I use Yahoo Finance as the source since it includes implied volatility. If you want to calculate your own implied volatility, remove the source argument and you’ll download data from Nasdaq by default. OpenBB also has a method that downloads all the options expirations.
Build the term structure
Now that you have the options chains, you need to do some pandas magic. But first, we need the last price of the underlying to find at the money options.
1last = (
2    openbb
3    .stocks
4    .load("SPY")
5    .iloc[-1]["Adj Close"]
6)
Download the price data and just grab the last adjusted close price from the DataFrame.
Now, find the at the money (ATM) options.
1idx = (
2    (chains.strike - last)
3    .abs()
4    .sort_values()
5    .index[0]
6)
7atm_strike = (
8    chains
9    .iloc[idx]
10    .strike
11)
To find ATM options, we need to find the index of the option that is ATM.
To do it, take the absolute value of the difference between the strike price and the underlying price and sort it in ascending order.
Then find the index of the first item in the list. With this index, find the strike price from the options chains DataFrame you created earlier.
Now it’s a simple filter on the DataFrame to get the ATM calls and puts.
1calls = (
2    chains[
3        (chains.strike == atm_strike)
4        & (chains.optionType == "call")
5    ]
6)
Take a look at the term structure for call options.
1(
2    calls
3    .set_index("expiration")
4    .impliedVolatility.plot(title="IV term structure for ATM call options")
5)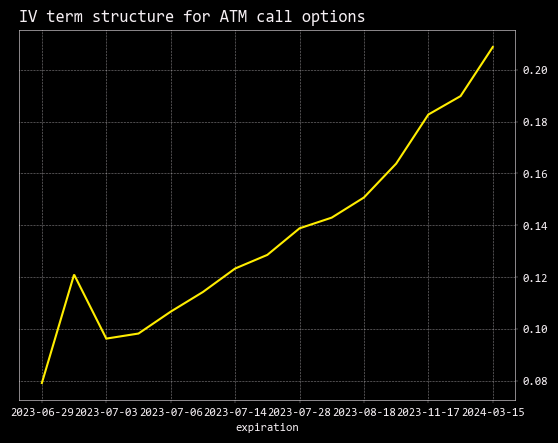
The term structure is normally upward sloping. There’s a few reasons for this:
1. Higher Future Uncertainty: More volatility expected long-term than short-term. The more time there is until an option's expiration, the more time there is for the underlying security's price to change dramatically.
2. Event Risk: Known potential events in the future (like earnings announcements, economic indicators release, etc.) that could cause the underlying asset to move significantly.
3. Time Premium: Longer-dated options have more time value, increasing implied volatility. The more time an option has until expiration, the greater the chance it has of becoming profitable for the holder.
There’s a spike in the curve since those options are expiring next week and traders are actively trading those contracts to reposition and speculate on future moves in the underlying.
Build the skew
To plot the implied volatility skew, select an expiration.
1calls = (
2    chains[
3        (chains.expiration == expirations[4])
4        & (chains.optionType == "call")
5    ]
6)
Instead of filtering the DataFrame by strike, we filter it by a single expiration.
Now plot the skew.
1(
2    calls
3    .set_index("strike")
4    .impliedVolatility
5    .plot(title=f"IV term structure for call options expiring {expirations[1]}")
6)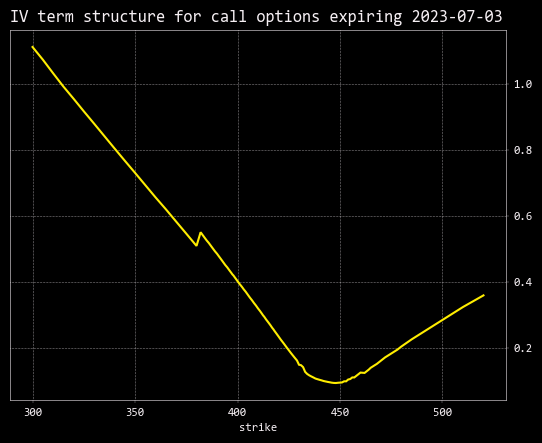
We see somewhere between negative skew and a volatility “smile.” In the case of negative skew, the market may be preparing for a drop and traders are bidding up out of the money options for downside protection.
A smile suggests the market might be expecting a big move in either direction. Smiles are often seen around news events or earnings announcements.
Action steps
There are two actionable steps you can take.
First, start by building code you can reuse to quickly plot and visualize the term structure and skew of implied volatility. Pro tip: use the code in this newsletter! Then include the analysis of term structure and skew into your options trading workflow. Second, follow the same steps with put options. Does the term structure and skew look the same?
