How to download more fundamental data to power trading


How to download more fundamental data to power trading
Quants, financial analysis, and traders use fundamental data for investing and trading. These data are derived from quarterly and annual statements that companies file with the U.S. Securities Exchange Commission (SEC).
These statements are rich with data that can be used to build predictive factor models for investment portfolios.
The problem?
We can’t download all these documents, parse them, and use them in a way that is useful for analysis at scale.
Until now.
How to download more fundamental data to power trading
The Edgar (Electronic Data Gathering, Analysis, and Retrieval) system is operated by the SEC. It automates the submission and retrieval of financial documents filed by companies. It also makes these data available electronically.
Edgar includes filings like annual reports (10-K) and quarterly reports (10-Q).
The data can be downloaded in various formats. These include HTML, XML, and plain text which makes it easy to use with Python.
After reading today’s newsletter, you’ll be able to download filing data, parse it, and use it to compute price to earnings ratio.
Let’s dive in!
Imports and set up
Let’s start with the libraries we need for the analysis. These libraries are standard Python libraries with the exception of OpenBB which we’ll use for data.
1import requests
2from io import BytesIO
3from zipfile import ZipFile, BadZipFile
4from pathlib import Path
5from tqdm import tqdm
6import pandas as pd
7from openbb import obb
8
9# Set the URLs to Edgar's data repository
10SEC_URL = "<https://www.sec.gov/>"
11FSN_PATH = "files/dera/data/financial-statement-and-notes-data-sets/"
12DATA_PATH = Path("edgar")
13user_agent = "Mozilla/5.0 (Macintosh; Intel Mac OS X 10_15_7) AppleWebKit/537.36 (KHTML, like Gecko) Chrome/121.0.0.0 Safari/537.36"
Download and extract the filing data
We first generate a list of filing quarters to download. In our example, we’ll grab 4 quarters worth of data in 2015. The Edgar filing data is large so make sure you start with only a few quarters to get things running.
1filing_periods = [
2    (d.year, d.quarter) for d in pd.date_range("2015", "2015-12-31", freq="QE")
3]
4
5for yr, qtr in tqdm(filing_periods):
6    path = DATA_PATH / f"{yr}_{qtr}" / "source"
7    if not path.exists():
8        path.mkdir(parents=True)
9    filing = f"{yr}q{qtr}_notes.zip"
10    url = f"{SEC_URL}{FSN_PATH}{filing}"
11    response = requests.get(url, headers={"User-Agent": user_agent}).content
12    with ZipFile(BytesIO(response)) as zip_file:
13        for file in zip_file.namelist():
14            local_file = path / file
15            if local_file.exists():
16                continue
17            with local_file.open("wb") as output:
18                for line in zip_file.open(file).readlines():
19                    output.write(line)
This code iterates over each filing period, downloads, and extracts SEC filing documents for each period. For each year and quarter, it builds a directory path and fetches the Zip file from the SEC website. The Zip file is then extracted and each file in the Zip archive is saved to the directory.
The next step is to convert the extracted files to the on-disk, columnar format, Parquet.
1for f in tqdm(sorted(list(DATA_PATH.glob("**/*.tsv")))):
2    parquet_path = f.parent.parent / "parquet"
3    if not parquet_path.exists():
4        parquet_path.mkdir(parents=True)
5    file_name = f.stem + ".parquet"
6    if not (parquet_path / file_name).exists():
7        df = pd.read_csv(
8            f, sep="\\t", encoding="latin1", low_memory=False, on_bad_lines="skip"
9        )
10        df.to_parquet(parquet_path / file_name)
11        f.unlink()
The code iterates through the downloaded TSV files in the DATA_PATH directory, converting each to a Parquet file in the 'parquet' subdirectory. For each TSV file, it reads the file into a DataFrame, writes the DataFrame to a new Parquet file, and then deletes the original TSV file.
Build the fundamentals data set
Now that we’ve stored the data from each of the filings as Parquet files, we can begin building the data set.
1sub = pd.read_parquet(DATA_PATH / '2015_3' / 'parquet' / 'sub.parquet')
2name = "APPLE INC"
3cik = sub[sub.name == name].T.dropna().squeeze().cik
4aapl_subs = pd.DataFrame()
5for sub in DATA_PATH.glob("**/sub.parquet"):
6    sub = pd.read_parquet(sub)
7    aapl_sub = sub[
8        (sub.cik.astype(int) == cik) & (sub.form.isin(["10-Q", "10-K"]))
9    ]
10    aapl_subs = pd.concat([aapl_subs, aapl_sub])
This code uses pandas to filter the sub DataFrame where the company name is APPLE INC. From there, we transpose the columns in the DataFrame to the rows, drop any rows where there is no data, and convert it into a Series. This code extracts Apple’s data from the quarterly and annual filing documents.
Use the fundamental data to build the PE ratio
First, extract all numerical data available from the Apple filings.
1aapl_nums = pd.DataFrame()
2for num in DATA_PATH.glob("**/num.parquet"):
3    num = pd.read_parquet(num).drop("dimh", axis=1)
4    aapl_num = num[num.adsh.isin(aapl_subs.adsh)]
5    aapl_nums = pd.concat([aapl_nums, aapl_num])
6aapl_nums.ddate = pd.to_datetime(aapl_nums.ddate, format="%Y%m%d")
7aapl_nums.to_parquet(DATA_PATH / "aapl_nums.parquet")
Now, we can select a field, such as earnings per diluted share (EPS), that we can combine with market data to calculate the price to earnings ratio.
1eps = aapl_nums[
2    (aapl_nums.tag == "EarningsPerShareDiluted") & (aapl_nums.qtrs == 1)
3].drop("tag", axis=1)
4eps = eps.groupby("adsh").apply(
5    lambda x: x.nlargest(n=1, columns=["ddate"]), include_groups=False
6)
7eps = eps[["ddate", "value"]].set_index("ddate").squeeze().sort_index()
8ax = eps.plot.bar()
9ax.set_xticklabels(eps.index.to_period("Q"));
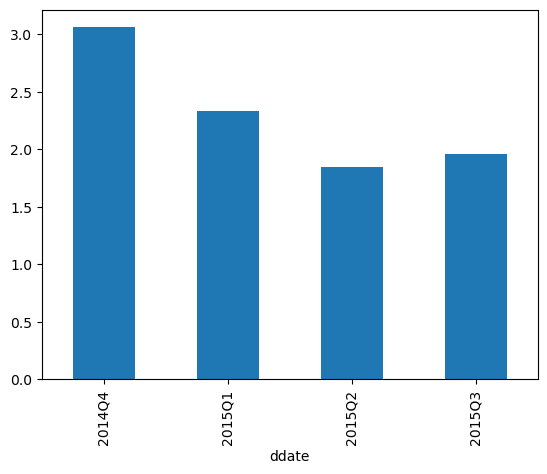
This code extracts the diluted earnings per share from each of the filings and plots it in a bar chart.

Now use OpenBB to grab market data and align it with the EPS data to compute the price to earnings ratios.
1aapl = (
2    obb.equity.price.historical(
3        "AAPL", start_date="2014-12-31", end_date=eps.index.max(), provider="yfinance"
4    )
5    .to_df()
6    .resample("D")
7    .last()
8    .loc["2014":"2015"]
9)
10
11pe = aapl.close.to_frame("price").join(eps.to_frame("eps")).ffill().dropna()
12pe["pe_ratio"] = pe.price.div(pe.eps)
13ax = pe.plot(subplots=True, figsize=(16, 8), legend=False, lw=0.5)
14ax[0].set_title("Adj Close")
15ax[1].set_title("Diluted EPS")
16ax[2].set_title("Trailing P/E")
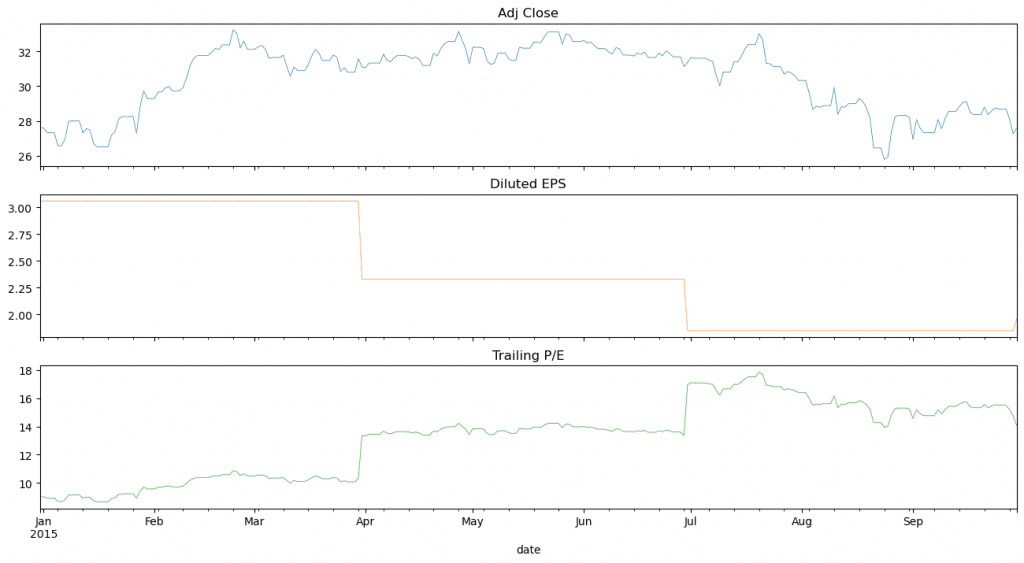
The result is a chart depicting the closing price, diluted EPS, the the trailing price to earnings ratio.

Next steps
We only scratched the surface of what is available through the Edgar filings. As a next step, extract and parse the following fields:
• PaymentsOfDividendsCommonStock
• WeightedAverageNumberOfDilutedSharesOutstanding
• OperatingIncomeLoss
• NetIncomeLoss
• GrossProfit
