


Pick the best strike and expiration for trading options
One of the hardest parts of trading options is picking the best strike price and expiration date for your strategy.
Whether a simple covered call or more complex strangles, the key to success is constructing the position.
But backtesting options is tough:
There are millions of contracts that trade daily, they expire weekly, and are assigned if deep in the money.
Recently, I stumbled on Optopsy that makes it easy to answer questions like "How do straddles perform on the SPX?" or "Which strikes and/or expiration dates should I choose to make the most potential profit?"
Today I'll show you how it works.
How to pick the best strike and expiration for trading options
Optopsy is a statistical analysis tool for options trading strategies, designed to integrate seamlessly into a Python data analysis workflow.
It supports several predefined strategies, including calls, puts, straddles, strangles, and vertical spreads.
You can analyze option strategies from historic option chain datasets. Optopsy outputs performance statistics across combinations of strikes and expirations.
Optopsy allows for customizations in bucketing options by days to expiration and moneyness and outputs results in DataFrames.
Let's see how it works!
Optopsy uses historic options data. Unless you're collecting data in a database every day, you may need to buy it from iVolatility or another source. You can follow along with today's newsletter with data you can download here.
Imports and set up
First, import the libraries we need. We'll use some base Python modules to import the CSV files.
After you download the sample data, unzip it to the same directory where you're writing the code.
This code searches a folder for all CSVs then loops through each one, reading the data into a pandas DataFrame. Finally, we concatenate the DataFrames together and save the result as a CSV. The result is 2,370,886 rows of historic options price data between January 2008 and December 2013 for the Russell 2000 index (RUT).
Loading data into Optopsy
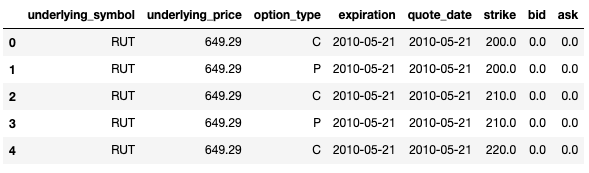
Optopsy loads data directly from CSV which is why we saved it first. Loading in Optopsy does all the standardization and formatting for us.
The csv_data function is a convenience function which uses the pandas read_csv method to do the import. The numeric values represent the column number as found in the sample file, the numbers are 0-indexed. The result is a nicely formatted pandas DataFrame.
Analyze strategies with Optopsy
Once the data is loaded, running strategies is one line of code. Let's start with a short calls strategy.
The result is a DataFrame that resembles the following:
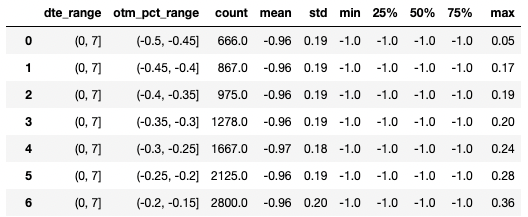
Let's break down the key output:
- dte_range: The range of days remaining until the options expire. For example, (0, 7] includes all options that will expire in 0 to 7 days based on the quote date.
- otm_pct_range: Range of how far out of the money the options are, expressed as a percentage. For example, (-0.5, -0.45] means the options are between 50% and 45% out of the money.
- count: The number of options contracts that fall within the specified dte_range and otm_pct_range. For instance, there are 666 options contracts that expire in 0 to 7 days and are 50% to 45% out of the money.
- mean: This is the average percent change of the options within the specified dte_range and otm_pct_range.
The other columns are additional descriptive statistics for the grouped contracts.
Let's analyze the performance of all short strangles that expire within 60 days, with a max days to expiration of 70, exit at 10 days to expiration, and each leg no further than 10% out of the money.
The result is a DataFrame that resembles the following:
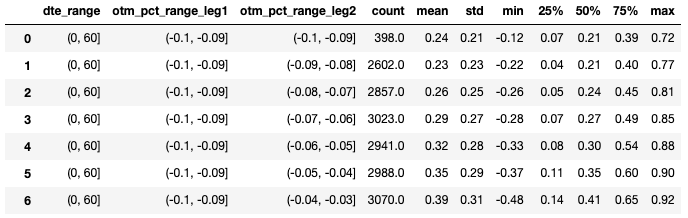
Let's break down the results in the last row.
There are 3,070 short strangles found between 0 and 60 days to expiration. The first leg, usually the put, groups contracts between 9% and 10% out of the money and the first leg between 3% and 4% out of the money. The mean return achieved by exiting this position at 10 days to expiration is 39%.
Next steps
After you download and extract the data, try running more strategies that come with Optopsy which can be found here. You can also try different combinations of filters and parameters to represent your trading style.