How to make amazing dashboards to easily power alpha analysis


How to make amazing dashboards to easily power alpha analysis
Principal component analysis (PCA) is used widely in data science. It’s a way to reduce the number of dimensions in a data set.
It's also used in quant finance to find alpha.
In a stock portfolio, a dimension might be a column of returns for one of the stocks.
Once you get the model built, you could spend your time tweaking the code.
Or, you can do it in an interactive dashboard to power your alpha analysis!
Today, we’ll build a Plotly Dash app that displays information about a factor analysis.
Let’s go!
How to make amazing dashboards to easily power alpha analysis

PCA isolates the statistical return drivers of a portfolio. These drivers are called “alpha factors” (or just factors) because they create returns that are not explained by a benchmark.
Quants use factors in trading strategies.
First, they isolate the components. Then they buy the stocks with the largest exposure to a factor and sell the stocks with the smallest exposure to a factor.
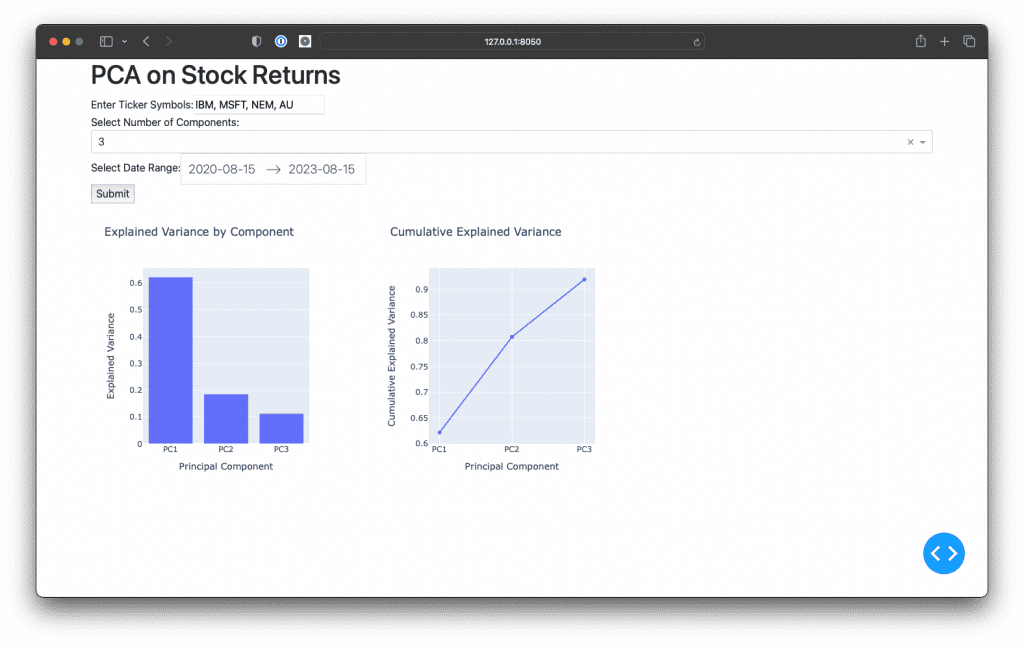
Today, we’ll create a Plotly Dash app that accepts a list of ticker symbols, identifies the principal components of their returns, and generates plots to visualize the top factors.
Imports and set up
All the code we’ll write should be in a Python file called app.py. Make sure you install Dash, Dash Bootstrap Components, and Plotly.
Let’s get the imports out of the way.
1import datetime
2import numpy as np
3import pandas as pd
4
5import dash
6from dash import dcc, html
7import dash_bootstrap_components as dbc
8from dash.dependencies import Input, Output
9
10import plotly.graph_objs as go
11import plotly.io as pio
12
13from openbb_terminal.sdk import openbb
14from sklearn.decomposition import PCA
15
16pio.templates.default = "plotly"
Build the app components
Initialize the app and construct the components of the user interface.
1app = dash.Dash(__name__, external_stylesheets=[dbc.themes.BOOTSTRAP])
2
3ticker_field = [
4    html.Label("Enter Ticker Symbols:"),
5    dcc.Input(
6        id="ticker-input",
7        type="text",
8    ),
9]
10
11components_field = [
12    html.Label("Select Number of Components:"),
13    dcc.Dropdown(
14        id="component-dropdown",
15        options=[{"label": i, "value": i} for i in range(1, 6)],
16        value=3,
17    ),
18]
19
20date_picker_field = [
21    html.Label("Select Date Range:"),  # Label for date picker
22    dcc.DatePickerRange(
23        id="date-picker",
24        start_date=datetime.datetime.now() - datetime.timedelta(365 * 3),
25        end_date=datetime.datetime.now(),  # Default to today's date
26        display_format="YYYY-MM-DD",
27    ),
28]
29
30submit = [
31    html.Button("Submit", id="submit-button"),
32]
Start with the text field to enter the list of ticker symbols, the dropdown to select the number of components, the date picker to select the range of data, and the submit button to run the app.
Combine the form elements and placeholders for visualizations to form the app layout.
1app.layout = dbc.Container(
2    [
3        html.H1("PCA on Stock Returns"),
4        # Ticker Input
5        dbc.Row([dbc.Col(ticker_field)]),
6        dbc.Row([dbc.Col(components_field)]),
7        dbc.Row([dbc.Col(date_picker_field)]),
8        dbc.Row([dbc.Col(submit)]),
9        # Charts
10        dbc.Row(
11            [
12                dbc.Col([dcc.Graph(id="bar-chart")], width=4),
13                dbc.Col([dcc.Graph(id="line-chart")], width=4),
14            ]
15        ),
16    ]
17)
Dash lets you build columns and rows in a typical grid layout using Python classes. These are then styled with the Bootstrap style library.
Build the callback
1@app.callback(
2    [
3        Output("bar-chart", "figure"),
4        Output("line-chart", "figure"),
5    ],
6    [Input("submit-button", "n_clicks")],
7    [
8        dash.dependencies.State("ticker-input", "value"),
9        dash.dependencies.State("component-dropdown", "value"),
10        dash.dependencies.State("date-picker", "start_date"),
11        dash.dependencies.State("date-picker", "end_date"),
12    ],
13)
14def update_graphs(n_clicks, tickers, n_components, start_date, end_date):
15    if not tickers:
16        return {}, {}
17
18    # Parse inputs from user
19    tickers = tickers.split(",")
20
21    start_date = datetime.datetime.strptime(
22        start_date,
23        "%Y-%m-%dT%H:%M:%S.%f"
24    ).date()
25    end_date = datetime.datetime.strptime(
26        end_date,
27        "%Y-%m-%dT%H:%M:%S.%f"
28    ).date()
29
30    # Download stock data
31    data = openbb.economy.index(
32        tickers,
33        start_date=start_date,
34        end_date=end_date
35    )
36    daily_returns = data.pct_change().dropna()
37
38    # Apply PCA
39    pca = PCA(n_components=n_components)
40    pca.fit(daily_returns)
41
42    explained_var_ratio = pca.explained_variance_ratio_
43
44    # Bar chart for individual explained variance
45    bar_chart = go.Figure(
46        data=[
47            go.Bar(
48                x=["PC" + str(i + 1) for i in range(n_components)],
49                y=explained_var_ratio,
50            )
51        ],
52        layout=go.Layout(
53            title="Explained Variance by Component",
54            xaxis=dict(title="Principal Component"),
55            yaxis=dict(title="Explained Variance"),
56        ),
57    )
58
59    # Line chart for cumulative explained variance
60    cumulative_var_ratio = np.cumsum(explained_var_ratio)
61    line_chart = go.Figure(
62        data=[
63            go.Scatter(
64                x=["PC" + str(i + 1) for i in range(n_components)],
65                y=cumulative_var_ratio,
66                mode="lines+markers",
67            )
68        ],
69        layout=go.Layout(
70            title="Cumulative Explained Variance",
71            xaxis=dict(title="Principal Component"),
72            yaxis=dict(title="Cumulative Explained Variance"),
73        ),
74    )
75
76    return bar_chart, line_chart
77
78if __name__ == "__main__":
79    app.run_server(debug=True)
This code implements a callback function, update_graphs, which ties our user inputs to the visualization outputs.
Every time the user presses the submit button, this function fetches the data, performs the PCA, and updates the visualizations.
You define a callback by using the callback decorator provided by Dash.
This decorator specifies which component properties to watch (Input) and which to update (Output). In our app, clicking the submit button triggers the callback function.
The callback parses the user inputs, downloads data, completes PCA, and generates the visualizations.
When you’re ready, to to the command line and run python app.py. Then open your browser to the URL that prints on the screen.
