


Find market mispricings like the pros with GARCH
Find market mispricings like the pros with GARCH
In today’s issue, I’m going to show you how to forecast volatility with GARCH.
Professional options traders don’t make bets that stocks will go up or down. They look for mispricings in the market. Mispricing happens when the market price is different than what a model says the price should be.
If the price of an option is $1.50 and the model shows it should be $1.75, a trader would buy the option “cheap” and wait for it to rise to $1.75.
Derivatives models use volatility to determine the value. So quants spend most of their time building the best volatility forecasts they can to find market mispricings. If you’re interested in using Python to price options, you might like my ebook.
And you can use the same tools as the quants.
GARCH is widely viewed as a better gauge of volatility than the standard deviation
Stock returns have two interesting features that GARCH models well:
- Variance error terms are autocorrelated (dependent on each other)
- Periods of high volatility tend to cluster
Dr. Tim Bollerslev developed GARCH in 1986 to address the problem of forecasting volatility in asset prices. It’s used in quant finance for risk management, derivatives pricing, and portfolio optimization.
By the end of this issue, you’ll know how to:
- Get stock price data
- Fit a GARCH model
- Forecast volatility
- Find mispricings
I’m going to show you how to do it all in Python.
Step by step.
Step 1: Get stock price data
Start by importing the libraries and getting the data. I like to use yfinance for getting stock data and NumPy for math functions. I use the excellent library arch to forecast volatility.
To control plot formatting, set options like figure size and font.
After the imports, grab some data.
Compute the simple returns and multiply by 100 to avoid the scaling warning from arch_model.
Step 2: Fit a GARCH model
Fitting a GARCH model is one line of code.
Calling arch_model like this does three things:
- Uses a constant mean
- Assumes a GARCH(1, 0, 1) volatility model
- Uses a normal distribution for the standardized errors
You can adjust these values - and even build your own mean and variance models - as inputs. Check out the documentation if you’re interested.
After you define the model, fit it.
The library uses an iterative algorithm called maximum likelihood estimation to fit the model parameters. Details of each iteration prints to the screen.
Step 3: Forecast volatility
Now the model is fit. Check the summary.
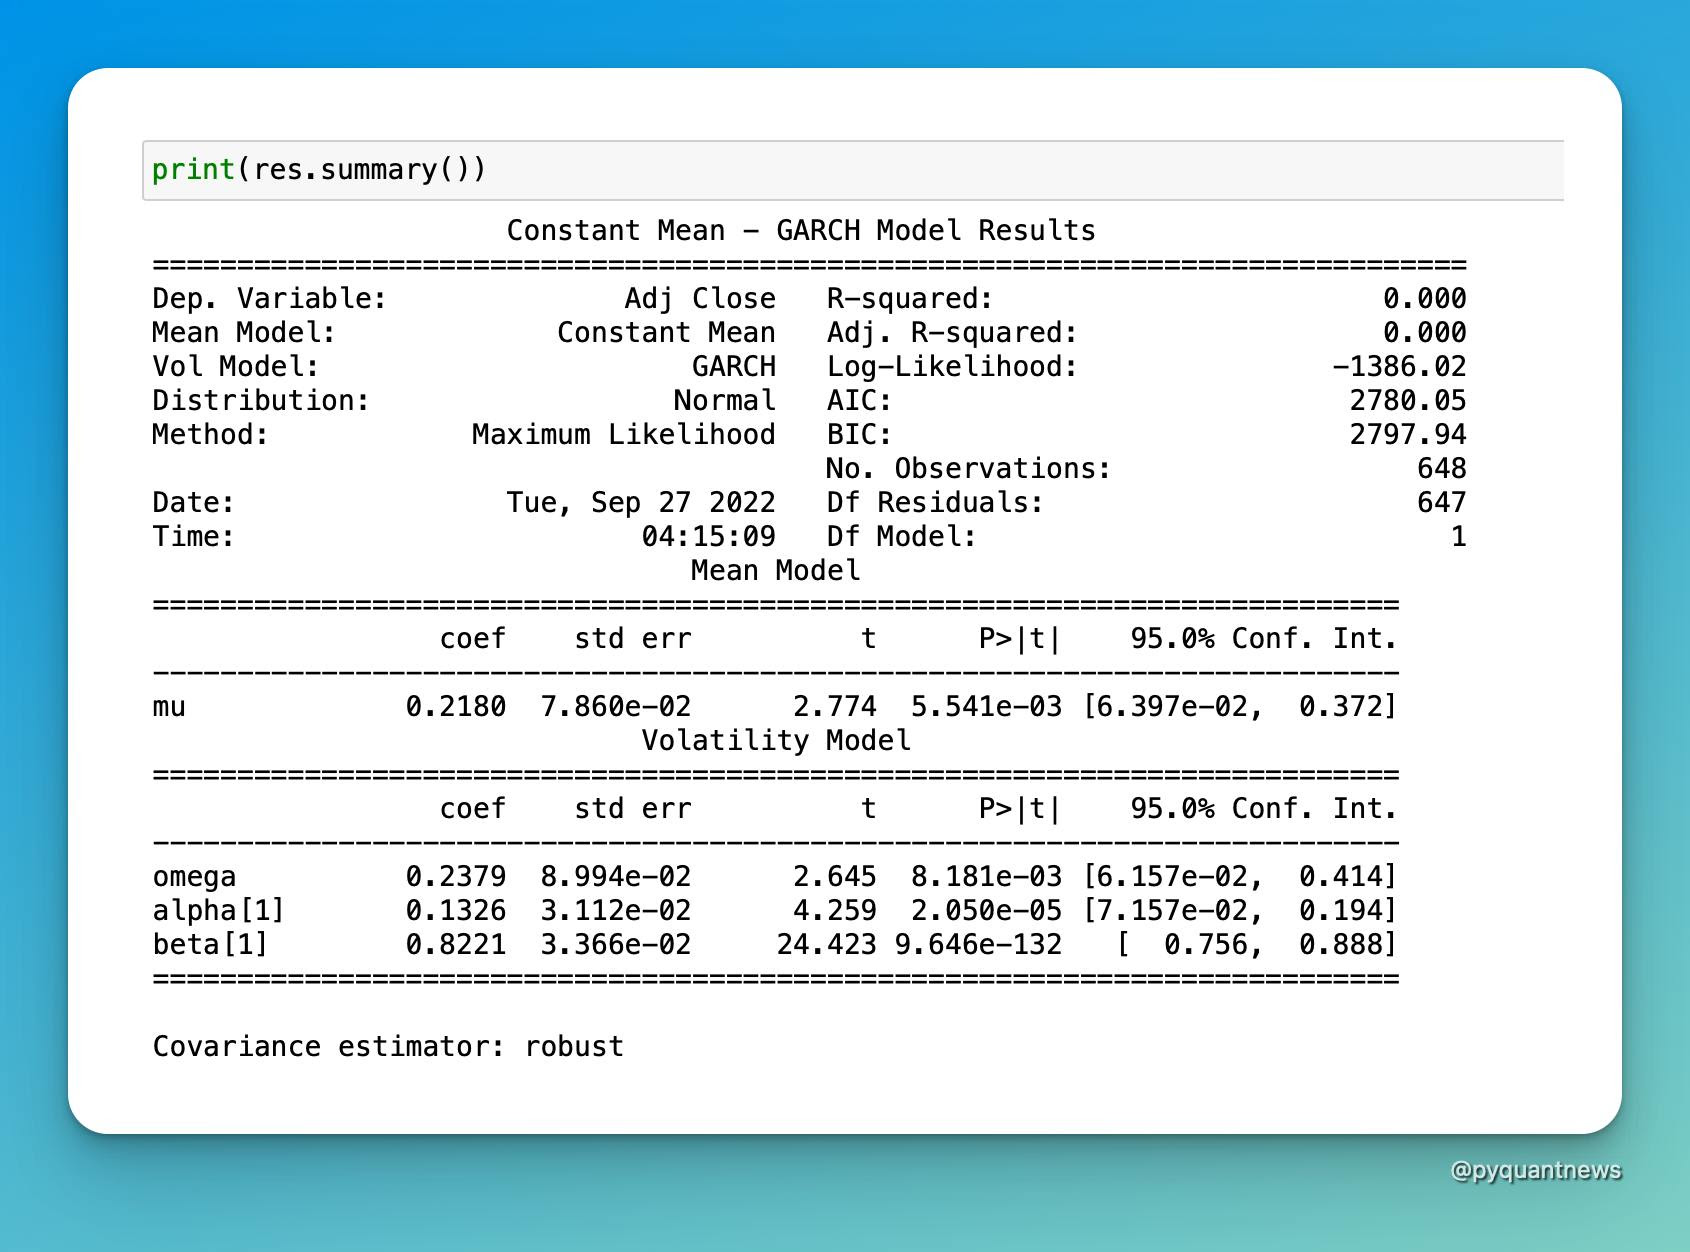
It shows the statistical significance of each of the coefficients. They all have very small p-values. We can assume the results are not due to random chance.
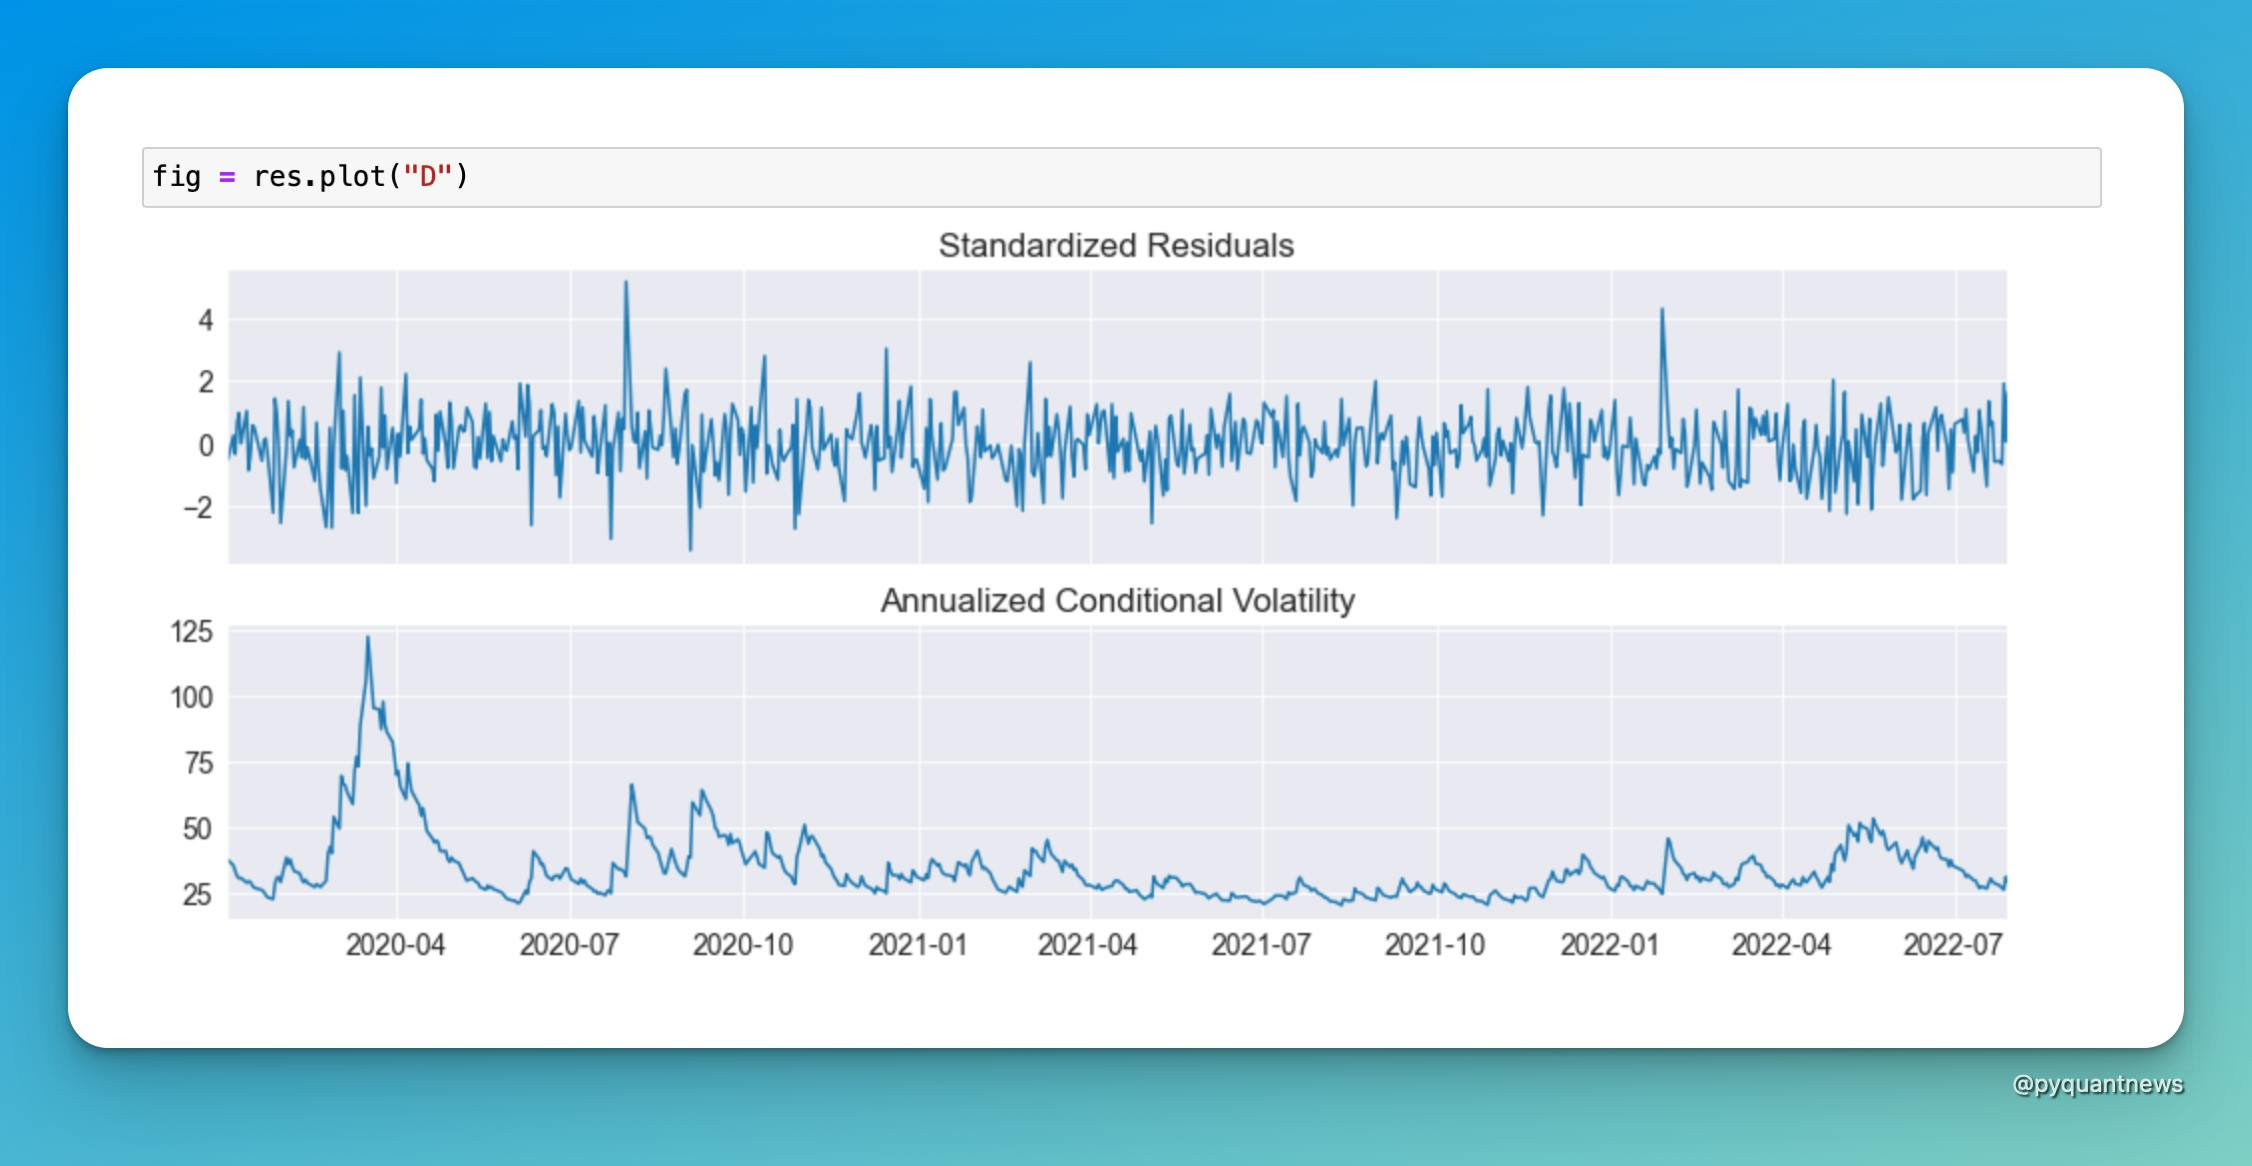
You can visualize the standardized residuals and conditional volatility.
Control the number of forecasts with the horizon argument. I use the first forecast in this example.
The library returns the variance forecast. To convert that to a volatility number, take the sqaure root. Then annualize it.
Step 3: Find a mispricing
Compare the standard deviation of returns to the GARCH volatility forecast. There’s a 10.7% difference. Use an options calculator and value an option using both volatility inputs.
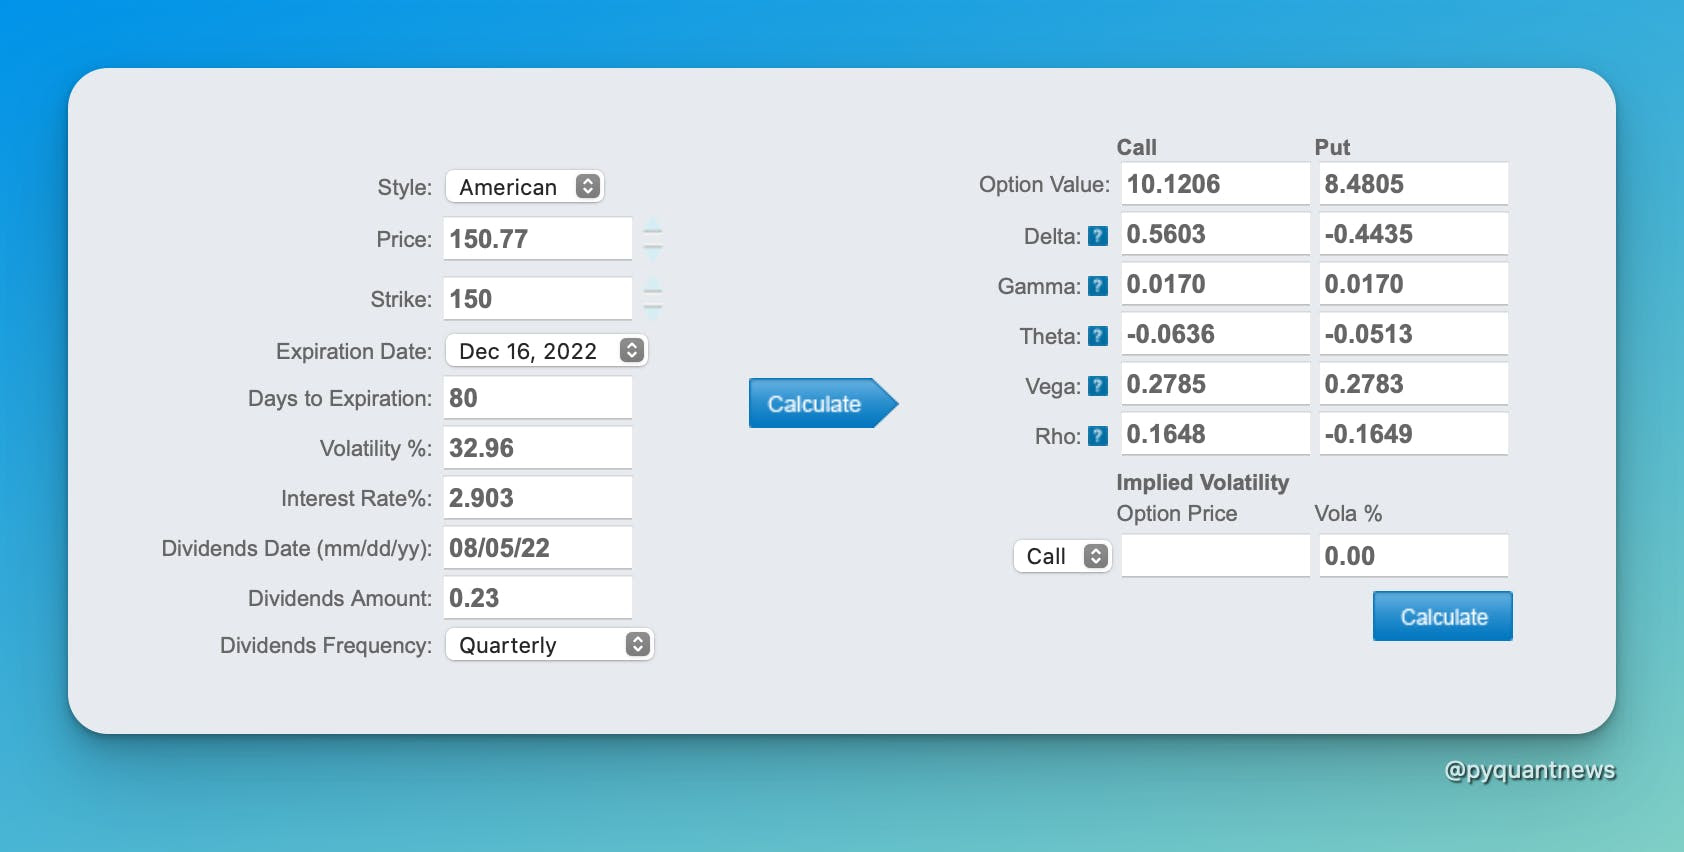
The value of a call option using the GARCH forecast for volatility is $10.12.
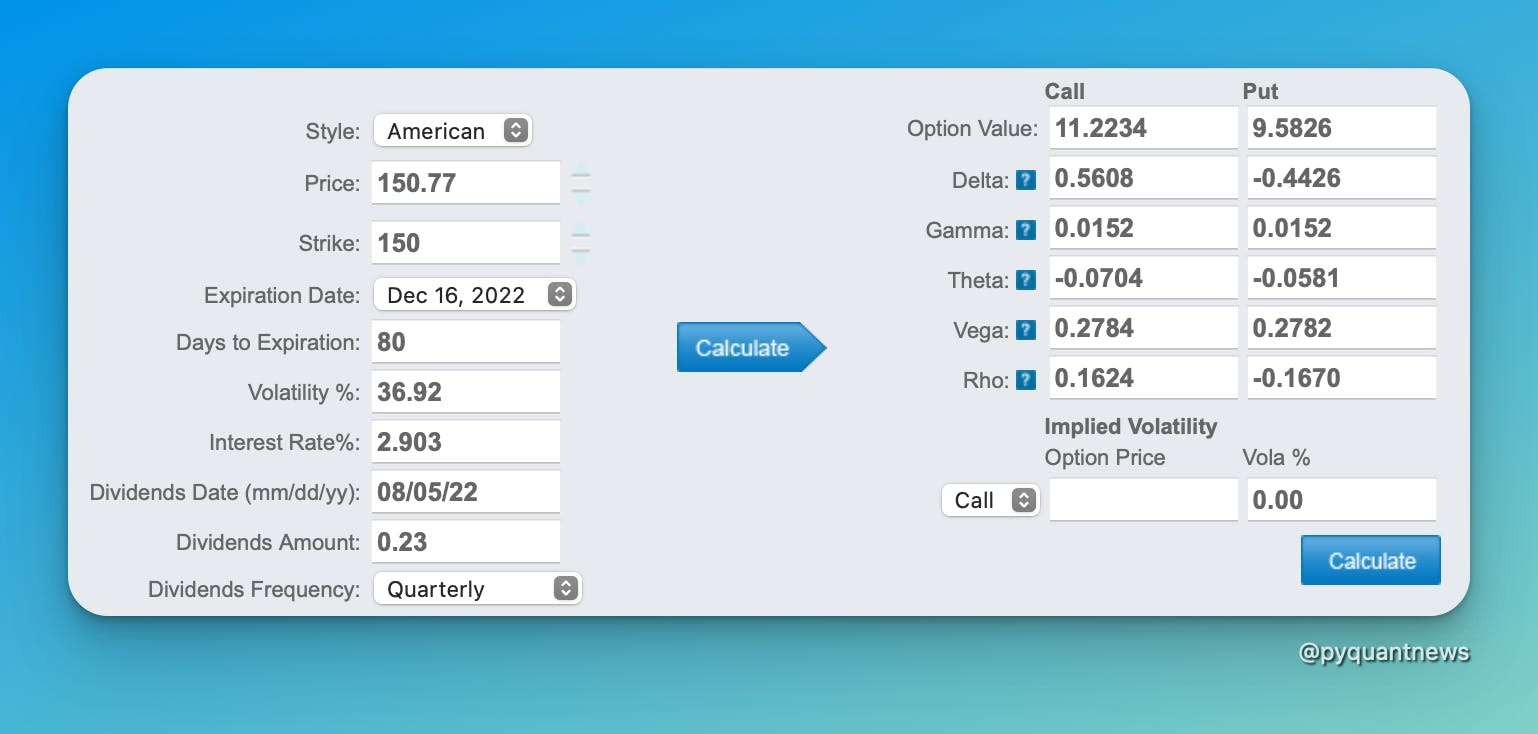
The value of a call option using historical volatility is $11.22.
If you believe the GARCH model is more accurate than the historical volatility in forecasting volatility, you’d sell this call option.