


The 2 tools for professional backtesting: Step-by-step Zipline for beginners
Backtesting is the only way to really test algorithmic trading strategies.
Doing it right will give you the best chance of making money.
Doing it wrong will guarantee a $0 account balance.
It's not your fault: most backtesting frameworks lack features that reflect reality.
Things like commission, slippage, and special order types are all things algorithmic traders need to worry about.
If the framework you use doesn’t have these things, then you have two options:
❌ Waste time rebuilding your strategies in a “production” framework
❌ Lose money when your strategy starts trading live
Neither sounds great.
So what can you do about it?
Today, you use professional backtesting tools Zipline and PyFolio.
Zipline is an algorithmic trading simulator. It was built and maintained by Quantopian before being acquired by Robinhood in 2020. It's is a professional backtesting framework which means you can use it for both research and live trading.
No more rebuilding your strategy.
Some of what Zipline offers:
✅ Ease of Use: Zipline gets out of your way so that you can focus on strategy development
✅ Realistic: Zipline includes life-like slippage and commission models, order types, and order delays.
✅ Batteries Included: Common statistics like moving average and linear regression are easy to use inside your strategy
✅ PyData Integration: Historical data and output of performance statistics use pandas DataFrames to integrate into other tools
✅ Statistics and Machine Learning Libraries: You can use libraries like scikit-learn to develop state-of-the-art trading systems
✅ Suite of performance and analysis tools: Zipline works well with performance analysis tools like PyFolio, Alphalens, Empyrical
Imports and setup
Start with the imports.
You’ll use pandas_datareader to get data to compare your strategy with the S&P 500, matplotlib for charting, and PyFolio for performance analysis.
Since you’re building the backtest in Jupyter Notebook, you need to load the Zipline “magics.” Running this lets you run the Zipline command line right in your Notebook.
Ingesting free price data
Zipline creates data “bundles” for backtesting. You can build custom bundles to ingest any data you want.
Today, you’ll use the pre-built Quandl bundle to ingest price data between 2000 and 2018 for free.
You will see Zipline working its magic to download the data and package it into highly efficient data stores.
Building the algorithm
Every Zipline strategy must have an initialize function. This is run at the beginning of the strategy.
Here, you set a counter to track the days, the symbol to trade, and set the commission and slippage models.
Every Zipline strategy must also have a handle_data function.
This function is run at every “bar.” Depending on your data, it might run every minute or day. handle_data is where your strategy logic lives.
In today’s example, you will build a simple dual-moving average cross-over strategy.
Use the counter to make sure there is enough data to compute the moving averages. If not, skip processing for the day.
If there is enough data, get 14 and 50 days' worth of prices and calculate the moving average.
Then, execute the trading logic.
When the 14-day moving average crosses over a 50-day moving average, the strategy buys 100 shares. When the 14-day moving average crosses under the 50-moving average, it sells them.
Run the backtest
The first step is to define the start and end dates.
Then, get data to compare your strategy with the S&P 500.
Finally, run the backtest.
Take a minute to explore the data in the perf DataFrame. There are 40 columns of rolling analytics! That’s the power of Zipline.
Analyze performance
Now that the backtest is finished, use PyFolio to get a breakdown of the results.
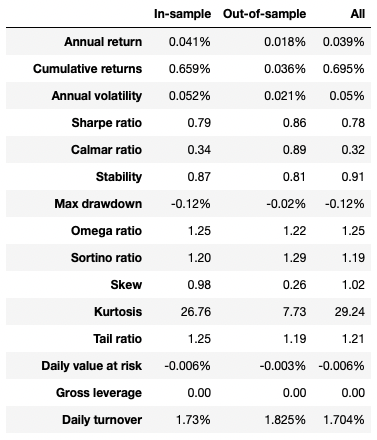
This creates a full tear sheet based on your backtest results. There’s a ton of information here, but here are the highlights:
Performance analysis
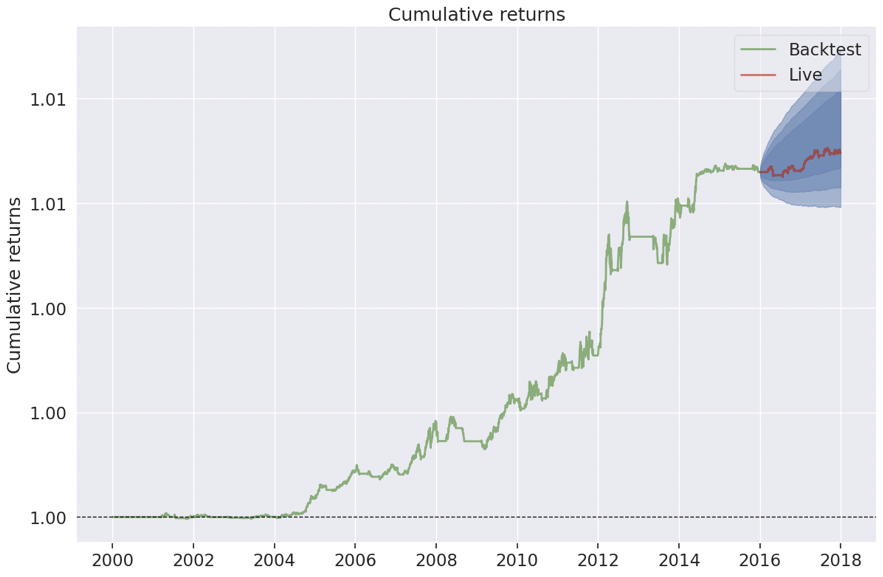
Cumulative returns
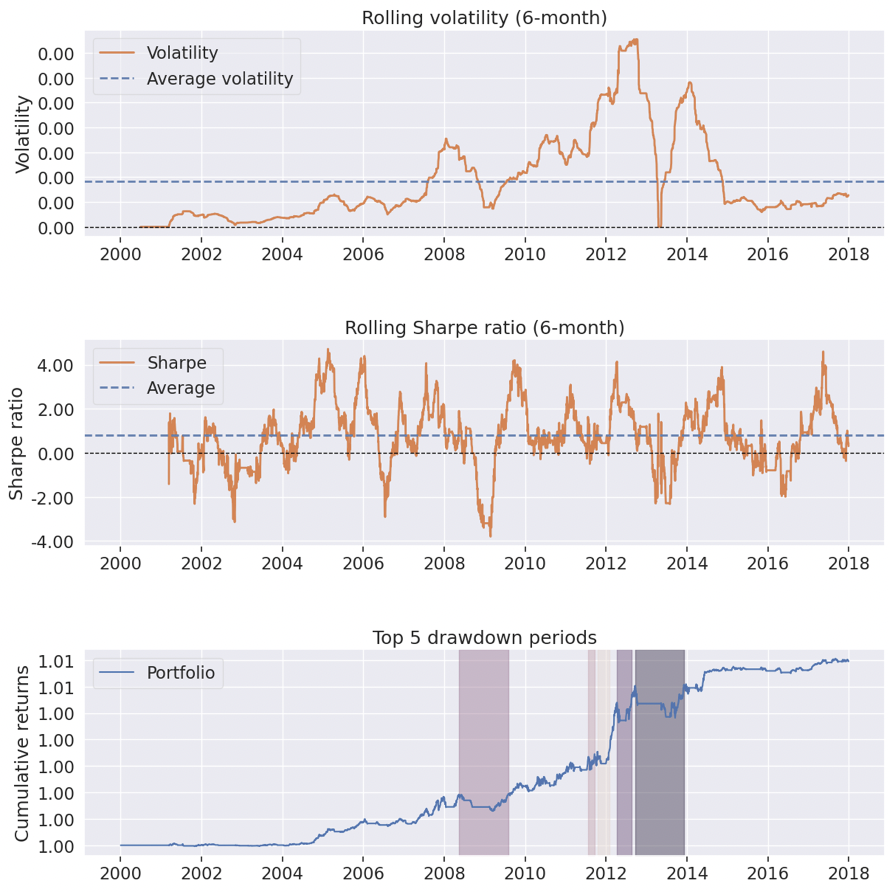
Rolling volatility, Sharpe ratio, and drawdowns
Now you’re comfortable setting up the Zipline backtesting framework. By doing so, you can use the most powerful toolset for algorithmic trading.