
Pandas DataFrame Visualization Tools
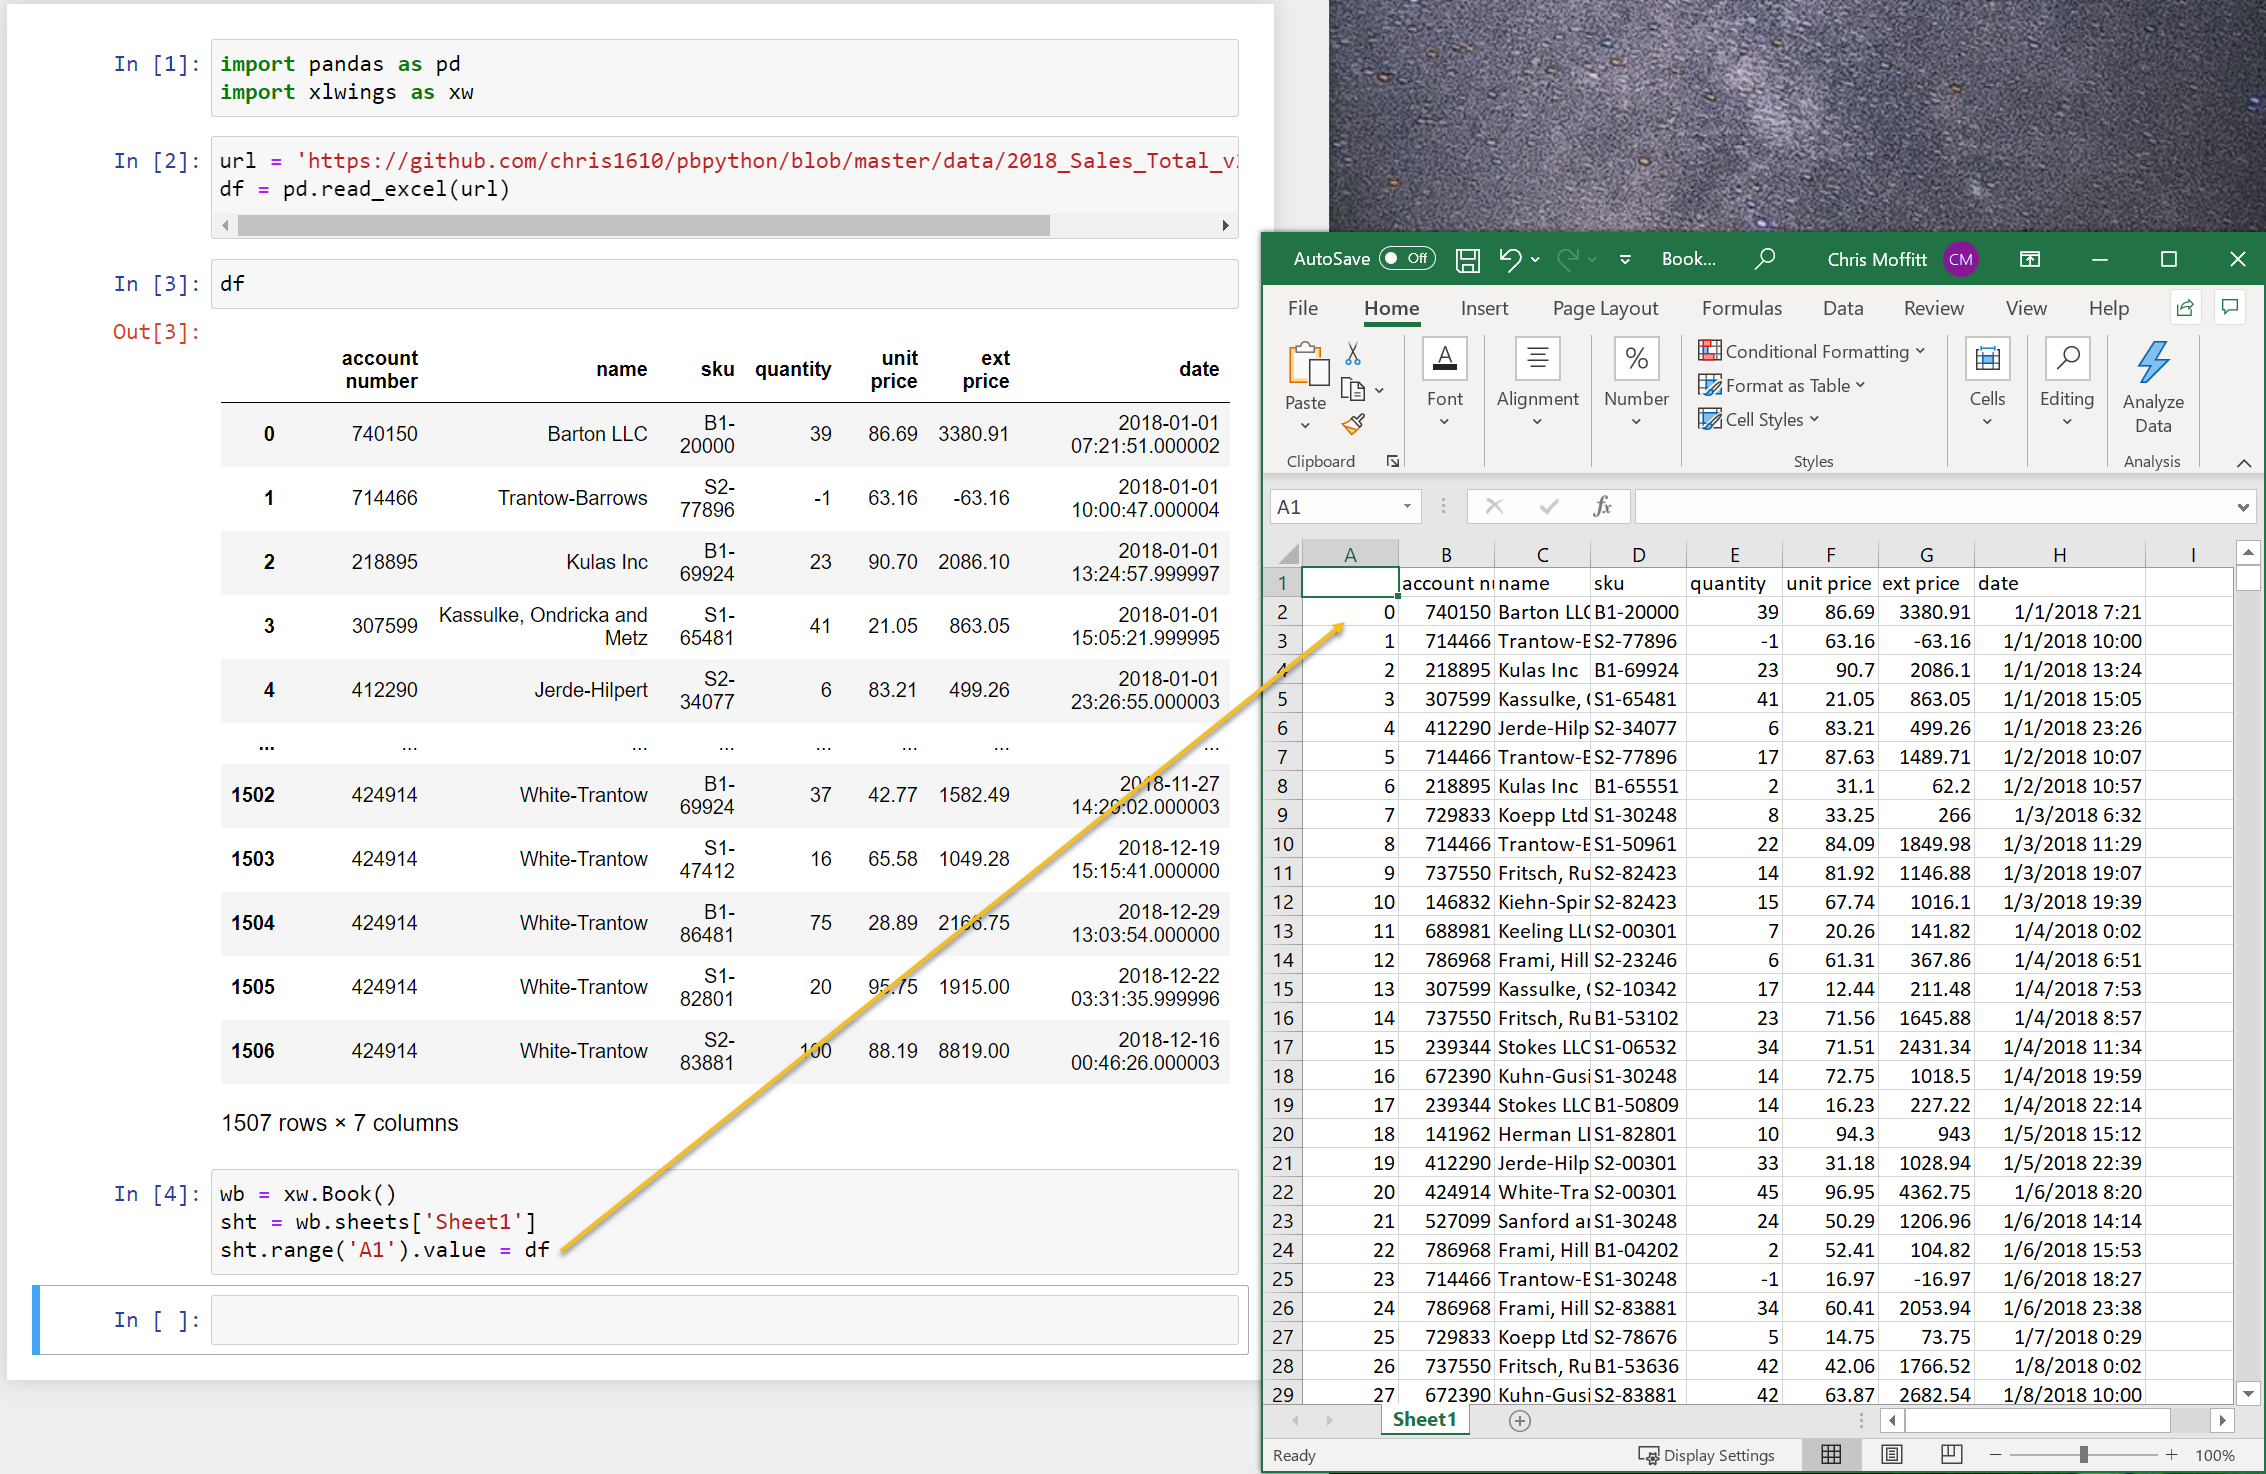
One of Excel’s benefits is that it offers an intuitive and powerful graphical interface for viewing your data. In contrast, pandas + a Jupyter notebook offers a lot of programmatic power but limited abilities to graphically display and manipulate a DataFrame view.
There are several tools in the Python ecosystem that are designed to fill this gap. They range in complexity from simple JavaScript libraries to complex, full-featured data analysis engines. The one common denominator is that they all provide a way to view and selectively filter your data in a graphical format. From this point of commonality they diverge quite a bit in design and functionality.
This article will review several of these DataFrame visualization options in order to give you an idea of the landscape and evaluate which ones might be useful for your analysis process.
View this article on https://pbpython.com/.