
Analyzing Stock Data Near Events with Pandas
Stock returns can be heavily impacted by certain events. Sometimes these events are unexpected or a surprise (natural disasters, global pandemics, terrorism) and other times they are scheduled (presidential elections, earnings announcements, financial data releases). We can use pandas to start analyzing stock data near events with pandas.
With pandas, users can get financial data of stock returns. They can also analyze the effects of these events on stock returns.
Notable Events that Affected Stock Returns
There are two most notable events that affected stock returns. One event is the covid-19 pandemic. The other is the great financial crisis caused by the 2016 US presidential election.
The Fed
The Federal Reserve interest rate announcement tends to impact the US markets in a large way. The FOMC meets on a regular basis to make decisions about interest rates. These decisions can have great impacts on the economy. Due to these decisions, most financial assets will need to change their prices.
Pandas is capable of reading an HTML page and returning it as a DataFrame object.
For instance, an event takes place on certain days at specific times. There can be an emergency that will cause the event to hold outside its normal day and time. This emergency can have an effect on the market and the stock prices. Pandas can help take a look at the event and its effect on the market and return the DataFrame.
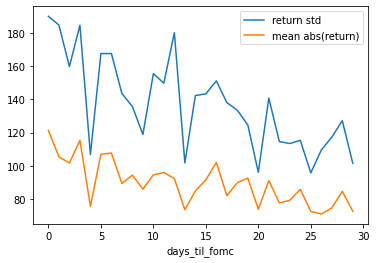
FOMC Impact
After analyzing the events, you then compare the returns of DataFrame. After this, merge the data. You can then see the effect of FOMC announcements on the data. The stock returns are high around the time of FOMC announcements. They decrease later on.
To successful use Pandas for stock data analysis, we optimize the following features:
- Loading csv data
- Downloading tables from a webpage
- DataFrame merging
- Boolean indexing
- Plotting using matplotlib
Read more at wrighters.io.